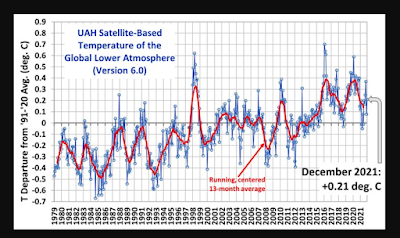
It's still well down, back to 1997. Spencer shows more noise than most plots, and this is probably more honest. The best indicator is Arctic ice volume, since that is an integration of cold over months. I look at ocean heat energy, which is also an integration.
For most signals, an integration is more stable. For example, peak acceleration in an earthquake is very jumpy, but velocity (one integration up) is more meaningful.
If you are a fan of straight-line extrapolations, then we still have a slope, but it is much less than the phillies like to think. Using physics, I refuse to extrapolate, ha ha. (it's going DOWN!)
ps. my sunspot buddy has hooked his wagon to a dead horse, and is still trying to get it going. He never reports when Spencer is up.
pps. this ends 2021 as low. nasa was only using end of year points to show warming. I can't wait to see how they handle this. Perhaps that's why they are going so much to asteroids.
No comments:
Post a Comment