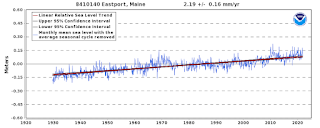
This is my favourite sea level gauge. For some reason, the tectonics here are in exact sync with the rapidly rising sea level.
Noaa has released a huge sea level rise of something like half a metre since 1860. That's amazing! So I found this chart where the rise after glaciation is totally still, and shows this dramatic rise.
Over in Maine. So, the burning of the first lump of coal has caused the same rising rate as today -- the Earth is sentient! I always knew that.
If you look at both charts, you can see in the fine detail, all our past warm and cold cycles. The Maine chart also has a big drop. I find that the world temp charts reflect this, within a month or two. The fine detail is caused by the expansion of ocean water when it warms or cools. It's an excellent thermometer.
The three of you who champion physics would know that the sea level has done squat since measurements began. All coastal sites go up and down like toilet seats, except for Astoria, Oregon. And since we can't take a measuring stick down to the centre of the earth, it's nearly impossible to precisely measure absolute sea level. It's all relative to something.
ps. you would look at the Maine chart and say that climate change started in 1930. But noaa would say there was a place down the road, that had the first gauge in 1860, with the same straight line. Okay, then it started in 1860, with the first lump of coal in a Christmas stocking. Life is so sweet. Let the Russians run over everything.


No comments:
Post a Comment